In order to run thr program one needs Java 5.0 environment. It may be downloaded here.
The program can be launched by clicking here or on the "Run program" button in the left menu.
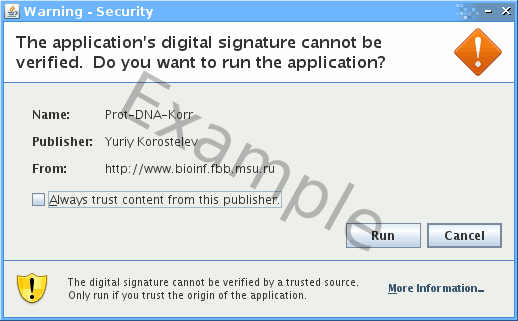
At the first use one needs to accept certificate to grant access to ones hard drive and network.
This is needed to read an input file from the hard drive and to submit it to the server.
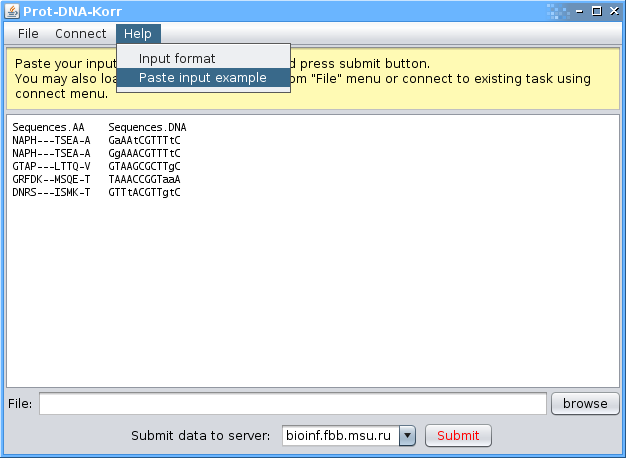
The protein and binding sites sequences are presented as a two columns table.
The first column should have a header (the first row) "Sequences.AA" and should contain aligned protein sequences.
The second column should have a header (the first row) "Sequences.DNA" and should contain aligned nucleotide sequences of the binding sites.
Protein and its binding site should be in the same row.
If protein has multiple binding sites, it should be repeated for each site.
sequences.AA	sequences.DNA
NAPH---TSEA-A	GaAAtCGTTTtC
NAPH---TSEA-A	GgAAACGTTTtC
GTAP---LTTQ-V	GTAAGCGCTTgC
GRFDK--MSQE-T	TAAACCGGTaaA
DNRS---ISMK-T	GTTtACGTTgtC
Note that the second and third rows correspond to one protein with two different sites. Sequences fields are case-insensitive.
One may paste the input example from the 'Help' -> 'paste input example' menu item.
Optional "weights.AA" and "weights.DNA" columns with custom weights can be provided. In this case weighting is not performed and weights are taken from the respective columns. Please note that the sum of the weights for proteins is expected to be equal to the number of proteins in input dataset. The same goes for sites.
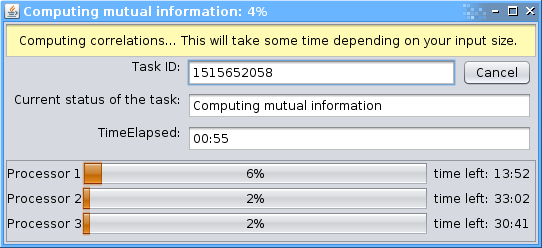
A window with the task being processed will appear. Note: one may access the task by ID number within 24 hours.
At the end of computations one will be asked to review the selected number of correlated pairs. The plot displays the probability (y-value) of a given number (x-value) of most correlated pairs to come from the normal distribution. The least probable number of pairs should be selected (corresponds to the global minimum), although fewer number of pairs may be preferred if their probability corresponds to a local minimum, which is about as low as the global minimum. One may select the desired number of pairs by clicking on the plot. One may zoom-in a region of the plot by drawing a box from the top-left to the bottom-right corner around the desired region. To zoom out draw A box from the bottom-right to the top-left corners.
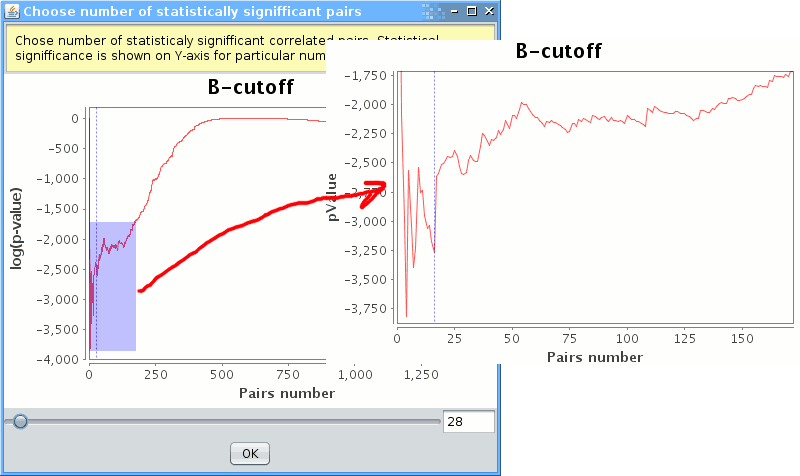 Note: One may redefine the number of correlated pairs by selecting the 'Edit' -> 'redefine correlated pairs number' menu item.
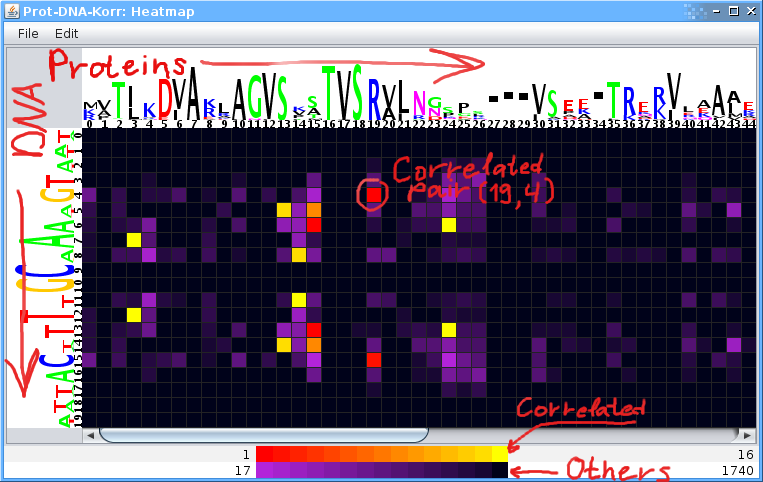
Correlated pairs of positions are presented as a colored matrix, the heatmap. The pairs are colored according to the statistical significance. Pairs with non-random correlation scores are colored with the red-yellow pallette (with red assigned for the most correlated pair). The violet-black pallette is used for other pairs. The X-coordinate corresponds to protein positions and the y-coordinate corresponds to nucleotide positions.
Note: You can change the default coloring by clicking on the pallette at the bottom of the window.
Logo on the matrix headers visualizes the residues composition and conservation levels of a position
Double clicking on a pair brings a window with the contingency table which contains numbers of 'amino acid'-'nucleotide' pairs.
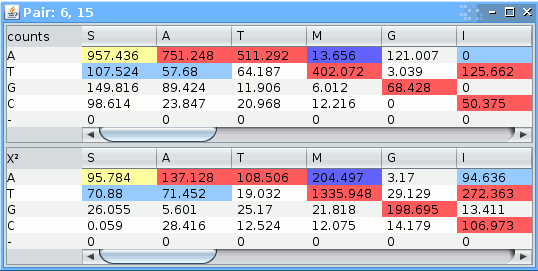
Pairs which occur more often than expected are colored red (strongly preferred) and yellow, those occuring less often than expected are colored blue (strongly avoided) and light-blue.
The threshold for coloring is based on the&Chi² score summand: , where: