Help Topics
Method Overview
-
Z-score
Z-score heatmap
Locally optimal segments
Structural profile
Z-score of a RNA sequence reflects significance of its secondary structure and is calculated as follows:
where E is the minimum free energy of a biological sequence, μ and σ
are the average and standard deviation of the energy distribution of
simulated sequences with preserved length and average dinucleotide composition.
Since minimum free energy of functional structured RNAs can be distinguished from that of random sequences,
unusual Z-scores represent potentially structured RNAs.
To obtain comprehensive knowledge about structured regions of a long sequence S,
we calculate Z-score Zij for each segment Sij of S
from position i to position j.
The Z-score matrix is visualized as a heatmap with intensity indicating segment Z-scores:

To provide time-efficient realization of this procedure, Z-score dependence on dinucleotide composition is fitted by quadratic regression
and dependence on length is fitted by linear regression.
Z-score surface allows to define locally optimal structured RNA segments.
A segment is called locally optimal if small changes in its boundary coordinates only increase Z-score.
Such segments correspond to local surface peaks:

Radius of the dark circle defines amplitude of small changes in boundary coordinates of the segment.
A new structural profile is called structural significance.
Structural significance of a position is the maximum squared Z-score of segments covering this position.
This measure is large if there exists highly structured segment of any size.
Input
Switch to input form by clicking on 'RUN' tab. Now you can run web-service with
your sequence (or sample).
- Enter your sequence
- Advanced paramters
- Probing Data
- Probing Data: background model
The input sequence must be in FASTA-format. Sequence can be either entered in the input form or uploaded as a file.
The maximum length is limited to 100000 nucleotides.
If sequence position in a genome is known, chromosome and starting position can be specified
in the form chromName:startPos.
Maximum Length: maximum length of segments for which Z-score calculation is performed.
Maximum length is limited to 300 nucleotides.
Minimum length: minimum length of segments for which Z-score calculation is performed.
Minimum length must be greater than 19 nucleotides.
Dinucleotide window: Z-score estimation of a segment requires background distribution of energies of random sequences.
Random sequence for the segment is a sequence with the same dinucleotide composition as the genomic context of the segment:

Dinucleotde window is the size of the genomic context of the segment.
Z-score threshold: in case of threshold < 0 only locally optimal segments with Z-score less than the threshold are reported.
Structured RNAs have negative and large absolute value of Z-score (because of energy negativity).
In case of threshold > 0 instead of calculating structured segments only locally-optimal unstructured segments with
Z-score more than the thresold are reported.
Smooth: heatmap can be smoothed with an exponential kernel. Kernel defines exponent in the exponential kernel.
The default value is 7. We recommend to use values from 4 to 10.
Local radius: amplitude of boundary changes of a segment in the definition of local optimalilty.
Default value is 7. Locally optimal paramter is limited to 50.
Custom track: interval-like features (genes, regulatory elements, non-coding RNAs etc.)
can be uploaded in BED-format file and visualized to compare with structural information from RNASurface.
Both strands: calculate Z-score profile for sense and reverse complement strands.
Each point of heatmap and structural significance plot represents the best value of segments on sense and reverse complement strands.
Locally optimal segments on both strands are shown.
If you don't have any probing data available, you just choose 'No probing data'. If you have probing data
for the input sequence there might be two options:
You have raw data: coming from SHAPE or PARS experiments. Then it is converted into probabilities densities
in program pipeline and then considered when running RNASurface algorithm.
You have probabilities densities of being paired and unpaired: you upload two files with this data,
and it is considered when running RNASurface algorithm.
If probing data is considered, then it is necessary to build background model by shuffling the data.
Parameters of shuffling are defined by P tail and number of random segments. You can switch off this option,
but keep in mind that then you cannot compare z-scores obtained with probing data and without probing data.
Output
Consider genome region covering two microRNA892 as example. The result can be loaded by clicking 'miR892 cluster' under sequence input form. The output consists of three main sections: main tab, tab with locally optimal segments and additional tabs with structural infromation of these segments. Download options are also available.
Main Tab
There exists global and local view of sequence features.
- Global view of sequence features
- Local view of sequence features
Upper panel of the plot represents features of the sequence region of interest which coordinates are specified in the panel 'Absolute positions'.
The region can be zoomed in or out by twofold ('Global zoom' option) and moved left or right by 1/3 of its length ('move plot' option).
To scale specific region one can click on the gray band and drag down.
The smallest sequence region is the minimum between 1000 nt and total sequence length.
Structural significance plot reflects strength of RNA secondary structures covering position; large values correspond to highly structured segments.
Annotation under the sequence line depicts optional user track in BED-format.
Thus, one can put together structural features of the sequence and user-specified features.
This example demonstrates large values of structural significance in regions of microRNAs.

Z-score heatmap is shown for a 1000 nt subsequence of the sequence region (or for the total sequence if its length is less that 1000 nt),
that is depicted as an empty rectangle under user track. Z-score heatmap is described here.
Locally optimal segments (defined here) are shown as white circles on the heatmap with correspondent line projections.
Local region corresponding to the heatmap can be moved along specified sequence region on the left or on the right by 1/3 of its length ('move heatmap' option).

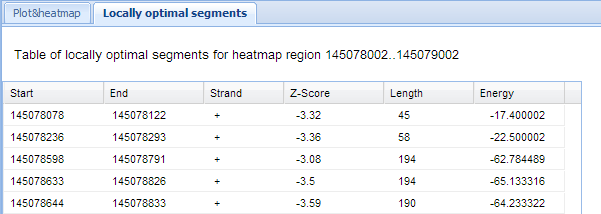
Locally optimal segments Tab
Separate 'locally optimal segments' tab contains description of positions, strand, minimum free energy and Z-score of locally optimal segments
which lie inside local region of the heatmap.
Structure and sequence of locally-optimal segment
To view and download figure of RNA secondary structure of a locally optimal segment,
one has to click inside the white circle on the heatmap.
A new tab named by segment position contains structure, options to download sequence and figure of structure, and basic segment description (position, strand and Z-score).

Alternatively a new tab can be opened by clicking to a line of the table with locally optimal segments.
Downloads option
'Downloads' tab allows to download measure of structural significance in WIG-format and list of locally optimal segments in BED-format for a whole sequence. If start position of the sequence in genome was specified, both files can also be downloaded by accounting for start position.
News
- 10. 10. 13
- Design update
- Our design was updated
Contacts
Moscow State University, FBB
E-mail: kintany@gmail.com