Server for predictoin transcription factor binding sites
Assume a background probability distribution for the considered value
and consider a set of n observed scores {vi}
that contains a mixture of
biologically significant and random values. Sort set of scores by
decrease. Using the background probability distribution, calculate
probability Pk that at least k
out of n observations exceed the observed score
vk . Find P*=min Pk
and let k*=argmin Pk. We suggest setting
the threshold score to vk*; P*
is the p-value for the selected set of scores. This approach maximizes
“non-randomness” of the selected subset of scores. While traditional
approaches are based on likelihood or confidence probability that are
local and do not take into account the complete data, our approach is
global and is based on the analysis of complete dataset.
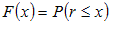
Let be a random variable with a known distribution (for example the
distribution of profile scores on random sequences):
Assume that we have n observations (for example, calculated
profile score in different positions of a sequence) producing values
{rk}. Fixing a threshold t one
selects kt values. The following question arises:
“what is better – to select small number of scores with a high threshold
or to select many scores with moderate threshold?” To answer this question
one can calculate the probability Pt(kt) that at
least k values from the set {ri}
exceed the given value t to select the threshold
providing the minimum to the probability . The motivation here is as
follow, biologically significant values (e.g. site scores) should be
“nonrandom”. We select a threshold t that provides the
highest degree of “non-randomness”. The obtained minimal value of
Pt(kt) can be used as the
p-value for the threshold t .
Clearly it is not necessary to scan all possible threshold values.
The best threshold necessarily is one of the observed values {ri}.
To minimize Pt(kt), sort the
set of observed values by decrease. Then scan the observed values and for
every k consider the threshold tk=rk
and calculate the probability Pk=P(rk).
The probability pk that exactly k
out of n scores exceed rk is given
by the Bernoulli distribution:
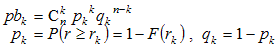
The probability Pk that at least k
values exceed rk is obtained by summation of the above probabilities:
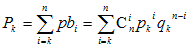 (1)
(1)
Scanning over all possible values k produces the minimum for
Pk and defines the threshold :
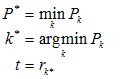 (2)
(2)
It is well known (Balakrishnan and Cohen, 1991) that if {rk}
are instances of the same random variable, then the values Pk,
P*, k* have the following properties:
Pk is uniformly distributed in the interval [0,1];
k* is uniformly distributed in the interval [1,n]. These
distributions do not depend on the distribution of the source random
variable r. The real objects (e.g. the real binding sites)
are not random and their scores do not follow the same distribution as
the source random variable r. Hence if the data set contains
real objects, the values Pk,
P*, k* will not have the above properties of
rank statistics and can be used as indicators that allow one to separate
the real data with non-random high scores from random noise. The
traditional approaches based on likelihoods or confidence probability
are local and do not take into account the complete set of data. On the
contrary, our approach is global and involves analysis of the entire
dataset. For example, suppose that the dataset {rk}
contains 15 values, ten of which have the significance pk=0.1.
In this case the local approach provides week significance 0.1 while our
approach produces the significance 1.9e-7. On the other hand,
if only one observation out of fifteen has significance 0.1 our approach
will give significance of the dataset 0.79.
Selection of significant positions in multiple alignment
Recognition profile constructed based on a multiple alignment should
include only significant positions; otherwise, the output would be
overwhelmed by noise. The information content I is a natural
quality measure for an alignment column k:
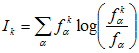 (3)
(3)
Here fαk is the observed frequency
character α in column k, fα
is the background frequency. To apply the rank statistic technique for
threshold selection one need the background probability distribution of
the information content. This distribution can be calculated in some
simple cases (for example if the character probabilities are uniform),
but in the general case it is unknown. In a general case this probability
can be obtained using the Monte-Carlo generation of random columns. We can
assume that the distribution for is normal or exponential.
Selection of sequences for profile construction
A typical problem of signal identification is as follows. Given a set of
sequences that presumably contain sites representing a signal, find this
signal. The most popular algorithms addressing this problem are MEME
and the Gibbs sampler. In real biological situations there is no
guarantee that all sequences contain sites. Methods of comparative
genomics can provide up to 50% of sequences that may not contain sites,
whereas expression arrays often produce even more irrelevant sequences.
Here we describe application of the rank statistics to select appropriate
(site-containing) sequences in the MEME setting. The algorithm identifies
the highest-scoring hits of the current profile in each sequence. Then
using the selected sites, it reconstructs the profile. At that point our
technique can be used to retrain only significant sites. We use the current
profile score as a measure of the site quality. We assume that the profile
score has the normal distribution (profile score is sum of independent
random variables, positional nucleotide weights). Hence, the probability
that the score exceeds a given value can be determined. Using the rank
statistics, we can select sites that should be included in the profile.
The modified MEME algorithm will have the following iterations:
- Select site and create a profile.
- Iterate:
- Find the best hit of the current profile in each sequence.
- Sort sites by score.
- Using rank, statistics define a threshold and select a subset
of significant sites.
- Using selected sites, create the new profile.
- Using rank statistics select positions that should be included in
the profile (determine word length)
Author:
Andrey Mironov |
Department of Department of Bioengineering and Bioinformatics, MSU, Moscow, Russia
|
Mail to Andrey Mironov
|